

Power BI for Retail: Sales, Inventory & Customer Analytics
Power BI for retail helps businesses convert their raw data into interactive dashboards and meaningful analytics. With the help of…
Read More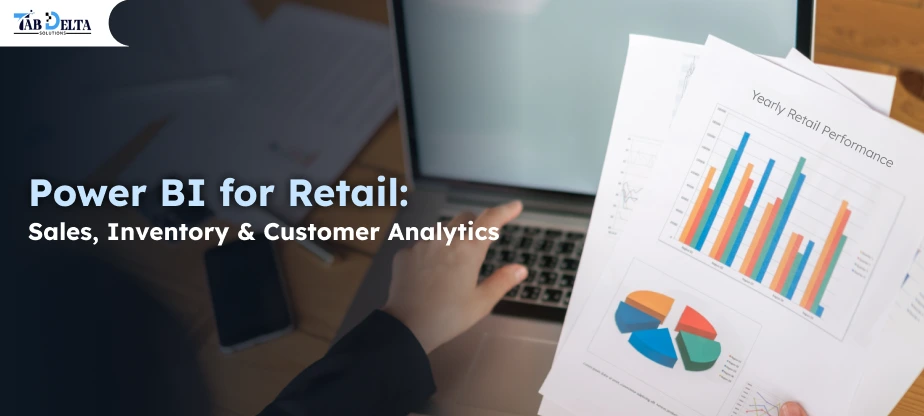
 11, October 2026
Power BI for retail helps businesses convert their raw data into interactive dashboards and meaningful analytics. With the help of Power BI for retail, retailers can track their sales performance, manage their inventories, analyze customers’ behavior, and uncover new growth opportunities all at once. Whether you own a small store or a big retail chain, Power BI allows you to make better decisions using your data. We will examine all this in this blog.
Every retail company is constantly generating huge amounts of data. This can be everything from sales data, inventory level, consumer needs and even performance of stores themselves. But, when this data is stored in different systems, it is quite hard to get an insight into what is going on within the business.
That is why Power BI for retail is so useful. Microsoft Power BI Development Services are a great way to transform the data generated in your business to visualized dashboards and reports which will save a lot of time on creating spreadsheets and provide insights into the important metrics and trends. Now let’s see how retailers can benefit from using Power BI.

Powe BI is a Microsoft product for business intelligence aimed at converting data into meaningful reports and dashboards. Retailers can use this product in order to perform analysis of the data collected via POS, inventory, eCommerce, CRM, and accounting systems. Using Power BI retail analytics, retailers may combine all these sources of data and get an insight into how various segments of their businesses perform.
For instance, using this tool, a retail manager can compare sales in different stores, determine products that are losing their popularity, and monitor stock levels without moving from one application to another.
Also, retailers can filter their reports based on various criteria such as location, product category, sales channel, and time. It makes it easier to find out why there was some change in performance. Simply said, the purpose is to convert data from retailing into insights for better decision making.
Track sales performance, optimize inventory, and understand customer behavior with custom Power BI dashboards tailored to your retail business.
Talk to a Power BI Expert
It is worth noting that retailers face a competitive market characterized by Power BI pricing levels, product availability, and experience of customers. In order to analyze the above factors, Power BI provides insights on business operations for retail organizations.
Different systems may be used to store retail data. Thus, sales may be collected in POS software, while stock data is gathered in an inventory management system and customer data is stored in CRM. By integrating different data sources, Power BI makes it possible to have all information in one reporting environment instead of using separate spreadsheets.
Creating reports manually can be a time-consuming process for businesses with a number of locations. Data refresh automation will allow you to spend less time on report creation.
Retail managers can benchmark store performance, product category performance, brand performance, and individual products. Managers can find good performing stores and explore bad performing stores to meet their objectives.
Also Read : Power BI for Financial Reporting: Dashboards, KPIs & Analytics
Inventory report gives information on those products that sell fast and those that occupy space in the warehouse. With this information, retailers can make inventory decisions.
Retailers can evaluate purchase behavior and repeat purchase behavior and even segment customers to get more customer insights.
Monitor store performance, identify fast-moving products, reduce stockouts, and make smarter inventory decisions with Power BI analytics.
Build My Retail Dashboard
With the Power BI retail dashboard it helps you see the right metrics.
Based on the available data, retailers may want to follow:
Performance by channel, including digital channels and personal contact. Interactive filtering functionality enables moving from general company information to detailed store and product information. In case the revenue declines in one of the regions, a manager will be able to look into product categories, discount campaigns, and sales channels. This is much more helpful than using a simple spreadsheet with totals only.
Also Read : Power BI Consulting Services: What to Expect & How to Choose the Right Partner
The analysis of sales enables retailers to gain insight into customers’ purchases, sources of revenue, and products that drive growth.
Power BI Sales Dashboard consolidates all of these metrics in one place for the sales teams and managers to keep an eye on their performance.
Retailers may analyze the following metrics:
For instance, a fashion retailer might find out that revenue from winter jackets is greater in one region while casual wear works better in another. The firm will be able to optimize its allocation of products and promotions using this information.
Through the use of retail sales analytics within Power BI, managers will be able to compare the actual sales with the projected ones and analyze the impact of promotions and other campaigns on sales. The outcome is clear insights into the sales performance.
Analyze purchase patterns, repeat customers, product preferences, and customer lifetime value with interactive Power BI reports.
Explore Retail Analytics Solutions
Inventory management impacts customer satisfaction and profitability directly. Low inventories may mean lost sales, whereas excessive inventories increase the cost of storing and tie up working capital. Power BI Inventory Dashboard assists retailers in tracking the flow of their inventory and spotting inventory issues.
Some important metrics related to inventory are as follows:
For example, in a supermarket that operates multiple branches, one branch might be having excess amounts of a particular item, but the other branch always faces an issue of stockout of the same item.
In such a scenario, a consolidated dashboard will assist the company to find out the difference and transfer inventory between the branches. However, reliable inventory information requires proper recording of inventory, standardization of product names, and proper update of data.
Also Read : Hire Power BI Developers: Cost, Skills & Hiring Guide
Insight into consumer behavior will allow retailers to create better relationships and marketing. With the help of power BI customer analytics, companies will be able to look at the transactions of the customers and discover patterns that may be hidden behind individual purchases.
Retailers are able to explore such areas as:
For example, the online retailer will be able to discover that customers buying skincare products usually return to make additional purchases within a couple of weeks. The marketing department can utilize the information to develop marketing campaigns around the issue.
Also, retailers can compare the behavior of the customers among online stores, offline stores and apps when reliable identifiers of customers are available. Consumer information should be handled with due diligence and the right amount of access control be put in place during the process of generating these reports.
Bring sales, inventory, and customer data into one view with automated Power BI dashboards designed for faster, data-driven decisions.
Automate Retail Reporting
There is no need for retailers to track all metrics possible. It is about picking the right KPIs that will help.
Here are 15 useful metrics to consider:
| KPI | Measurement |
| 1. Total Revenue | Total sales generated |
| 2. Sales Growth Rate | Percentage change in sales over time |
| 3. Units Sold | Number of products sold |
| 4. Average Order Value | Average revenue per order |
| 5. Gross Profit | Revenue minus the cost of goods sold |
| 6. Gross Margin | Gross profit as a percentage of revenue |
| 7. Sales per Store | Revenue generated by each store |
| 8. Sales per Square Foot | Sales relative to retail selling space |
| 9. Inventory Turnover | How quickly inventory is sold and replaced |
| 10. Sell-Through Rate | Percentage of available merchandise sold |
| 11. Stockout Rate | Frequency or proportion of items unavailable for sale |
| 12. Days Inventory Outstanding | Estimated days inventory remains on hand |
| 13. Repeat Purchase Rate | Share of customers who purchase more than once |
| 14. Customer Lifetime Value | Estimated value generated by a customer |
| 15. Return Rate | Percentage of sales or units returned |
These KPIs need to be computed with consistent definitions and source data. Sales growth needs to compare with similar periods, and the gross margin computations need to incorporate the retail store’s cost definition.
Below are five such examples.
This dashboard provides a general idea of revenue, profitability, sales growth, inventory status, and customer performance for business leaders. This helps executives to find out significant changes and make decisions regarding additional analysis.
With the help of this dashboard, store managers can compare sales forecasts, revenue, number of transactions, and average sale per transaction among various stores.
Such a dashboard can be used by regional managers to determine which stores need additional help.
This dashboard focuses on sales of top-selling products, poor categories of products, profit margins, and product returns. The information provided in the dashboard can be used by merchandisers in their assessment of product mix and promotions.
Also Read : Power BI vs Tableau vs Looker: Detailed Comparison
The Inventory Dashboard provides information about the inventory position, inventory turnover, and slow-moving products. This assists the inventory department in determining any potential stockouts and overstock situations.
The customer dashboard has the details of the repeat order rate, customer segmentation, buying behavior, and retention. This kind of data can be used by the marketing department for analysis and interaction purposes. In summary, the above examples illustrate how the power of retail analytics using Power BI may benefit various departments in decision-making without making the dashboards generic.
Uncover sales trends, improve inventory turnover, and identify growth opportunities with customized retail business intelligence solutions.
Discuss Your Power BI Project
There are many aspects that can affect the retail demand: seasonality, promotion, price, local preferences, and others. The forecasting will let the company be prepared for all these changes instead of being experience-based. Power BI can unite the sales history data, seasonality, inventory, and forecasting result in one report.
Thus, for instance, a retailer is able to analyze monthly sales during several years to determine the seasons with maximum sales. Then it is possible to compare this information with the available inventory and current promotions.
Additionally, Power BI can perform forecasting using visual analytics and integration with external forecasting models. Advanced versions of Power BI allow integration of machine learning models or other services to predict the future demand.
Still, the past data does not guarantee the future success. The efficiency of forecasting will depend on the data, market environment, and the way of forecasting.
Also Read : Why Businesses Should Invest in Power BI Development in 2026
Unify sales, inventory, and customer data with custom Power BI dashboards. Track retail KPIs, identify sales opportunities, data-driven decisions with Tabdelta’s Power BI expertise.
Talk to a Power BI Expert
For retailers to be able to sell their goods, they will require information on how sales have been performing and what inventory levels exist among other factors. It is clear that Power BI for retail serves as a great solution that will enable a retailer to consolidate all necessary data through use of interactive dashboards and reports.
From measuring performance of a store to finding out slow moving items and repeat purchase of goods, power BI allows retail employees to go beyond spreadsheets and make better decisions.
It is essential to combine correct data, KPIs, good dashboards designs, and performance review. Retailers need to start with questions that are most critical to their businesses and gradually increase analytical skills.
Power BI for retail will play a crucial role in a retailer’s strategy to get improved visibility in operations, satisfy customer demand, and sustain growth.
The term Power BI is for retail is a business intelligence tool that helps retailers understand sales, inventory, and customer behavior. It converts data from different systems into interactive dashboards and reports.
Power BI in retail analytics retailers combine sales, inventory, and customer data in one place. They can compare store performance, track product sales, monitor stock levels, and understand customer purchasing habits.
Retailers should track important KPIs such as total revenue, sales growth, units sold, average order value, gross profit, inventory turnover, stockout rate, repeat purchase rate, and product return rate. These metrics help businesses understand sales performance, control inventory costs, measure customer loyalty, and identify opportunities to improve profitability.
Yes, absolutely!!! Power BI can track retail inventory by connecting to inventory management systems, databases, or spreadsheets. Retailers can monitor stock levels, inventory turnover, slow-moving products, overstock, and stockouts.
Yes, sure. Power BI can analyze customer behavior using transaction history and customer data. Retailers can identify customer segments, repeat purchases, purchase frequency, average spending, and frequently purchased product combinations.
Yes, absolutely. Power BI can create interactive retail sales dashboards that display revenue, units sold, sales growth, profit margins, and store performance. Users can filter results by product, location, date, or sales channel.
Yes, Definitely!! Power BI Power BI forecast retail demand with historical sales, seasonal trends, and inventory data. Retailers can use built-in analytics features or connect external forecasting and machine learning models.
Power BI can connect to various retail data sources, including point-of-sale systems, Excel spreadsheets, SQL databases, ERP software, CRM platforms, e-commerce applications, and cloud services..
The cost of a Power BI retail dashboard development depends on its complexity, data sources, integrations, design, and security requirements. A basic dashboard may cost a few hundred dollars, while a complex retail analytics solution can cost several thousand dollars or more.
Explore our latest research on cutting-edge tech trends and discoveries to stay ahead in this digital-first landscape!